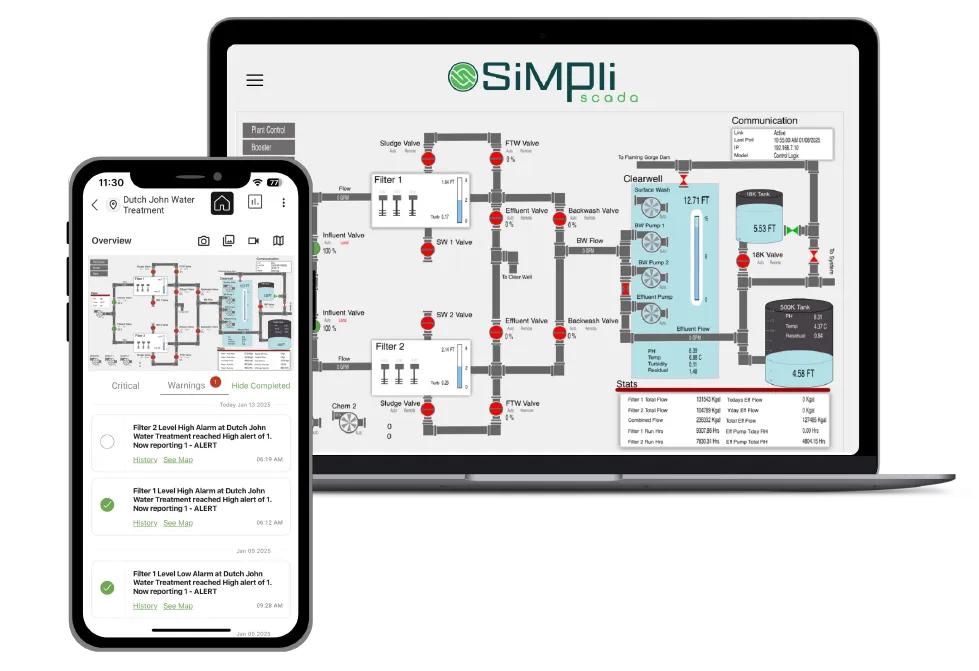
Complex systems create complex interfaces
Operators need to monitor large amounts of live equipment data, alarms, trends and controls without losing sight of what needs their attention.
The challenge was to simplify the experience without simplifying the information.
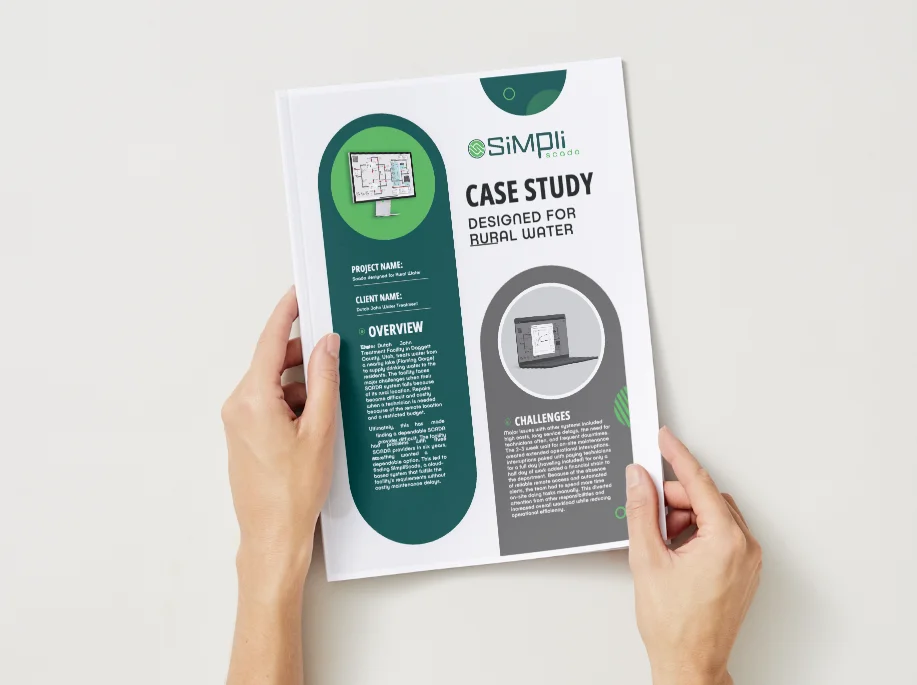
Learning from the people already doing the work
I surveyed users of existing SCADA products and researched competing platforms to understand common workflows, frustrations and expectations.
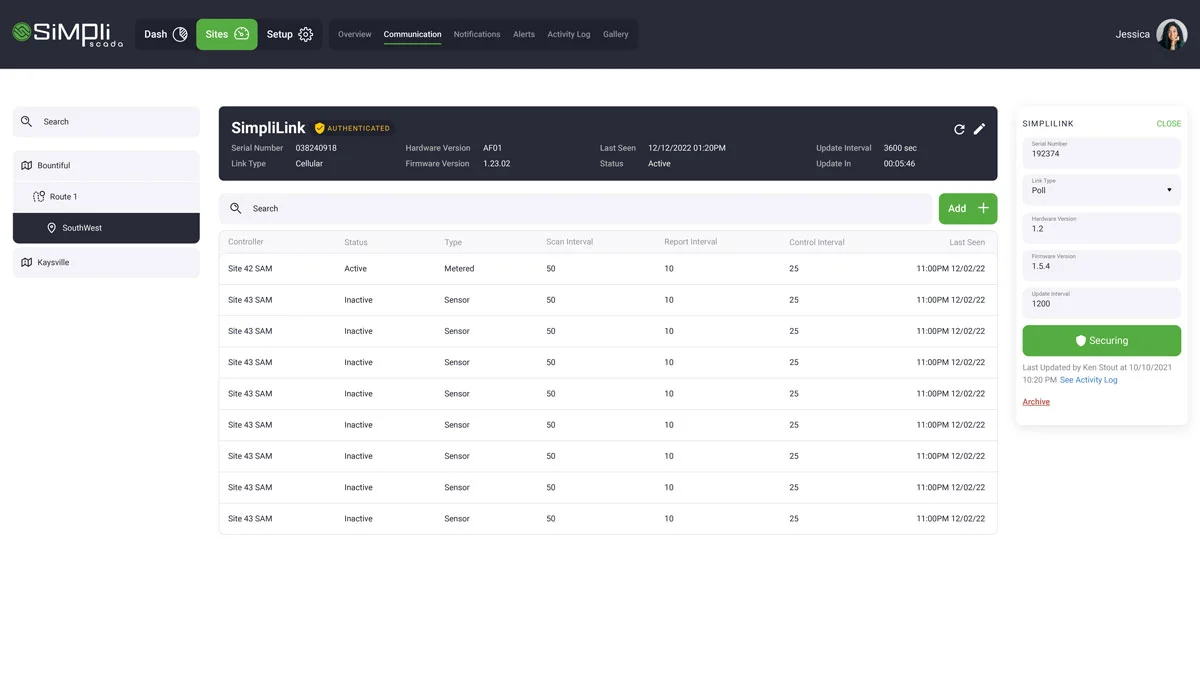
Data density wasn’t the problem. Poor hierarchy was.
Operators needed a lot of information available at once. The opportunity wasn’t to remove data, but to make it easier to scan, understand and act on.
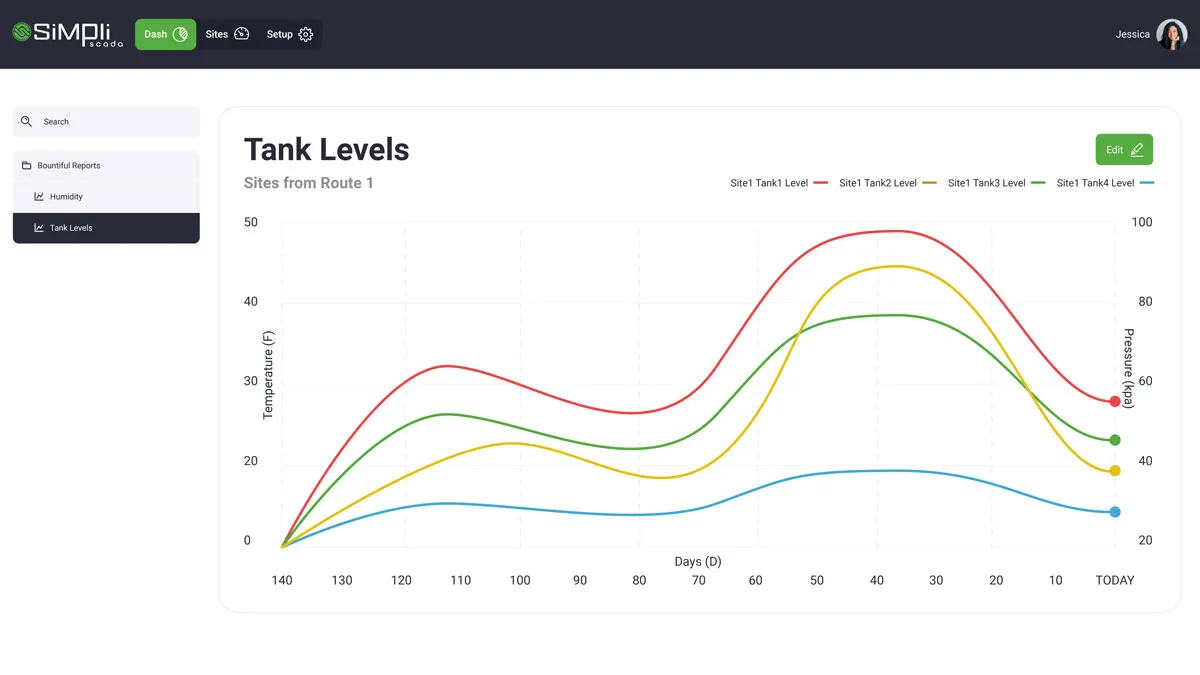
Turning machine data into human decisions
Working closely with the product owner, I translated technical requirements into clear workflows, dashboards, data visualisations, equipment monitoring, alarms and controls.
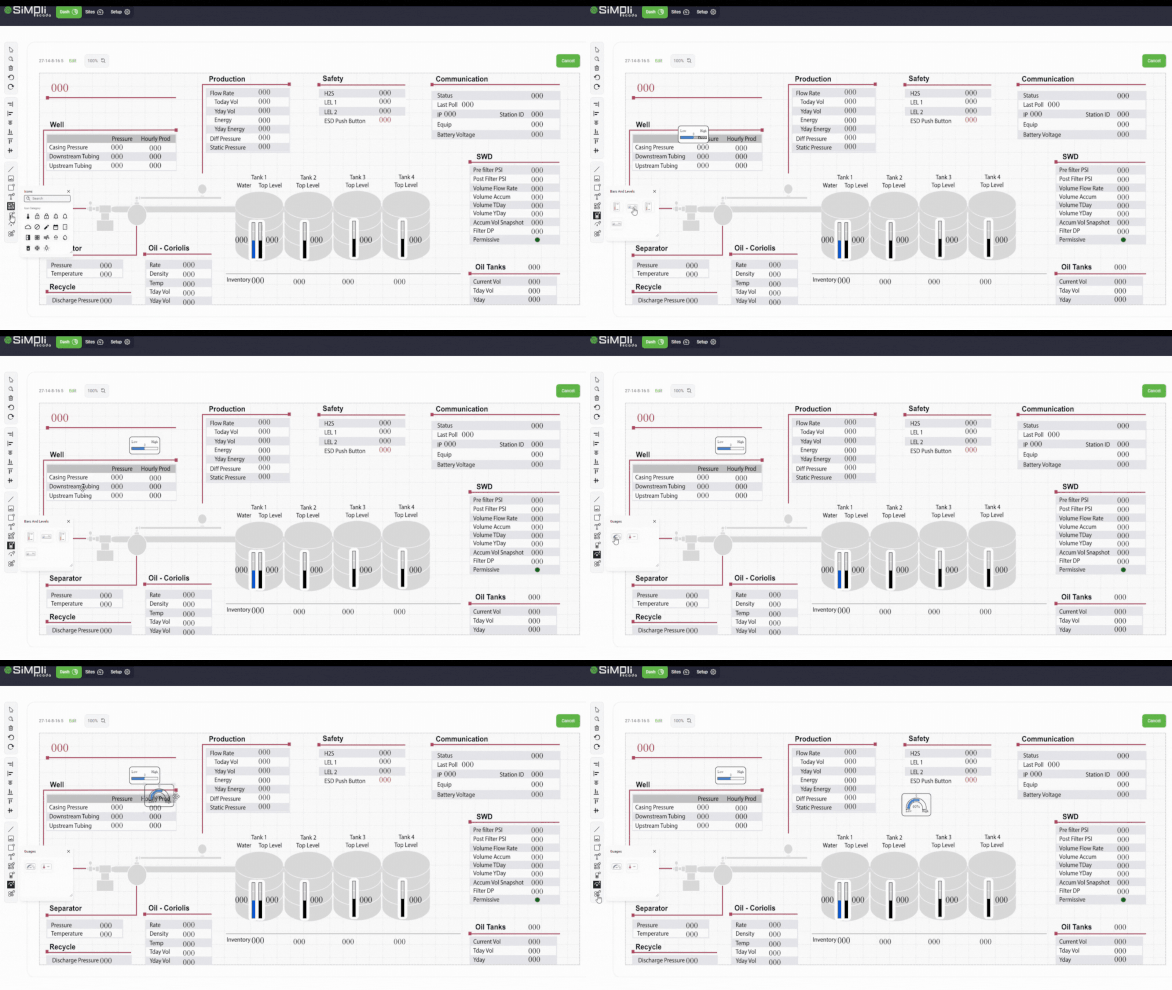
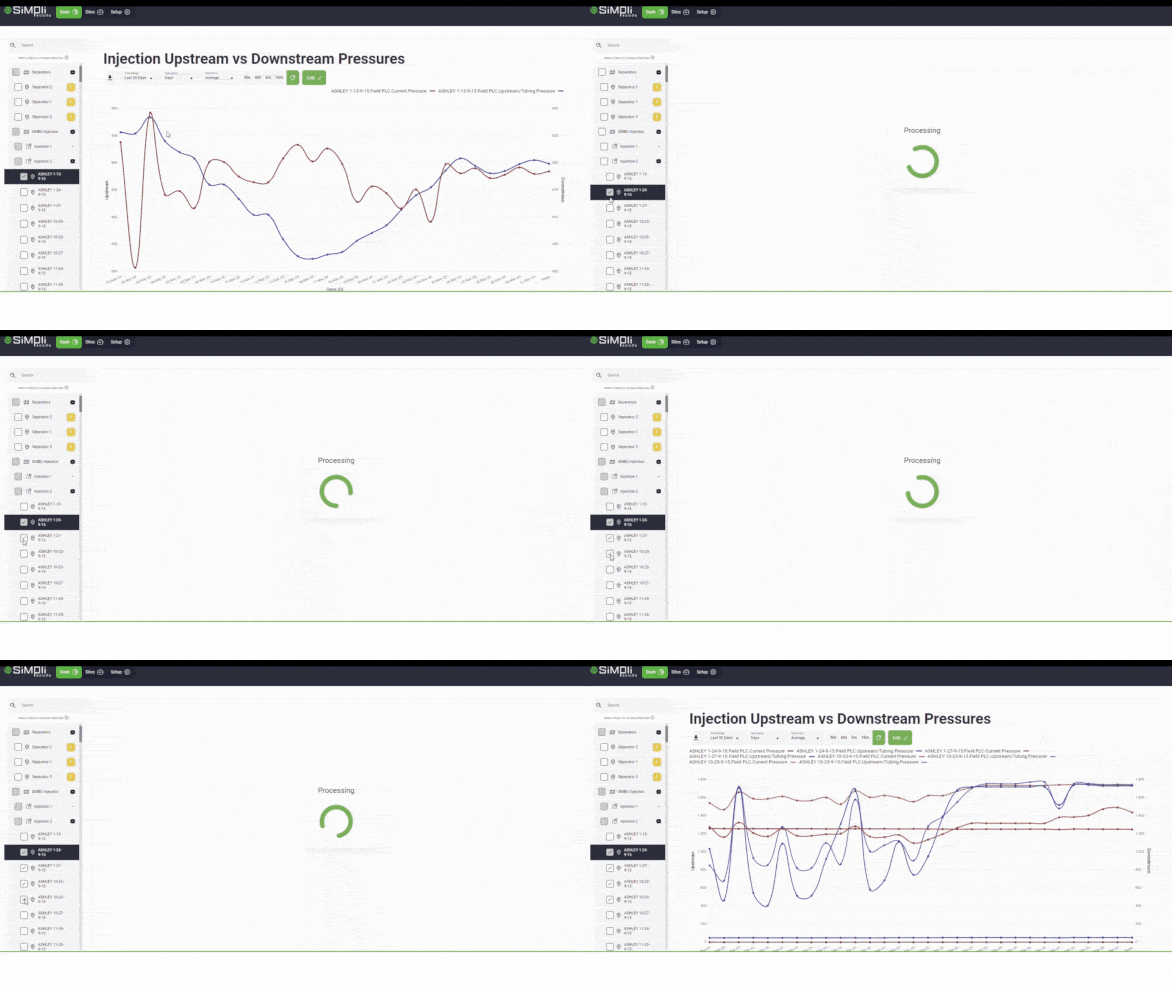
From thousands of readings to what matters now
Pressure, flow, temperature, tank levels, equipment status, production and alarms could all be monitored across multiple assets and locations.
Clear hierarchy helped operators quickly identify normal operation, changing conditions, and problems requiring attention.
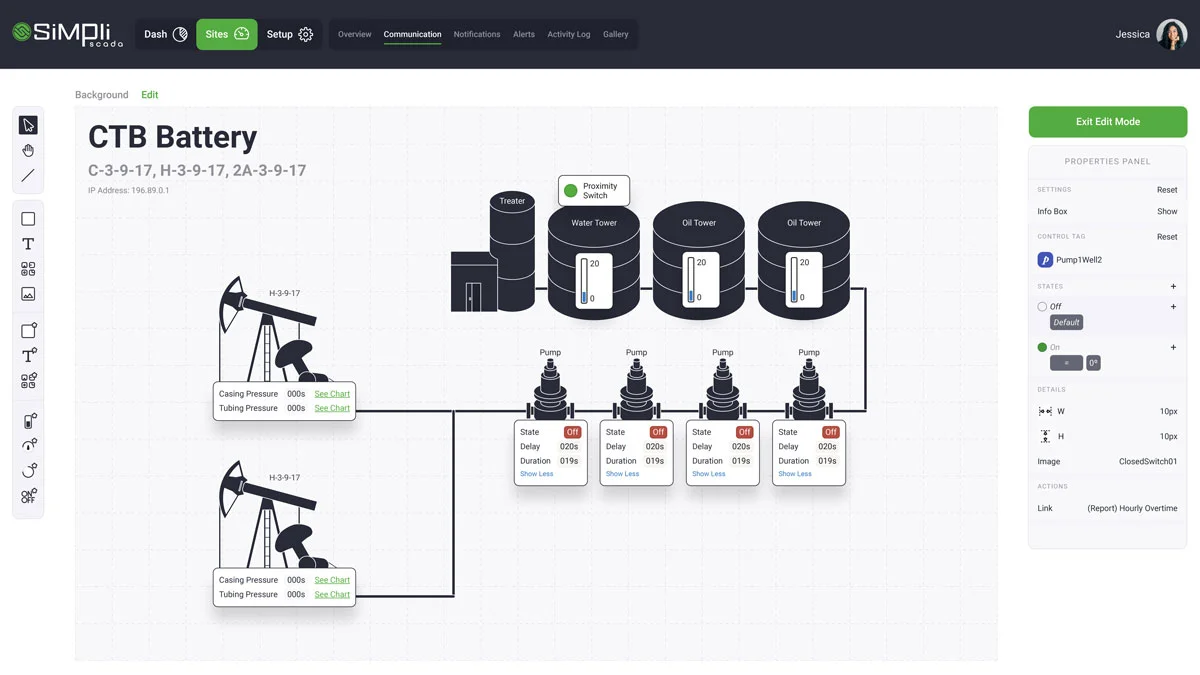
Making physical equipment visible digitally
Visual interfaces connected real-world equipment to live data, helping operators understand the state of pumps, tanks, valves and other assets at a glance.
Simplify the experience without simplifying the information.SimpliScada (the brief)